Fukui function
The Fukui function is a concept in density functional theory (DFT) that helps identify regions in a molecule that are more reactive and provides insight into chemical reactivity and selectivity. It quantifies the change in electronic density in a molecule when an electron is added or removed. The positive Fukui function indicates sites susceptible to nucleophilic attack, while negative values indicate sites susceptible to electrophilic attack.
In this tutorial we will look at the Fukui function of butyrolactone, a cyclic lactone known to undergo a nucleophilic attack at the carbon atom of the carbonyl group. It can also be protonated or coordinated by the oxygen of this carbonyl group during an "electrophilic attack" [Gazquez1994]. For a more detailed discussion of the chemistry of butyrolactone see here.

Butyrolactone, a cyclic lactone.
How to run the calculation
Fukui functions can be conveniently generated using the Fukui workflow.
You can download the XYZ file butyrolactone.xyz
to calculate the fukui function for the butyrolactone example or create the structure yourself.
The Fukui workflow is invoked using the following command:
weasel butyrolactone.xyz -fukui
Alternatively, you can use the SMILES string:
weasel -smiles 'C1CC(=O)OC1' -fukui
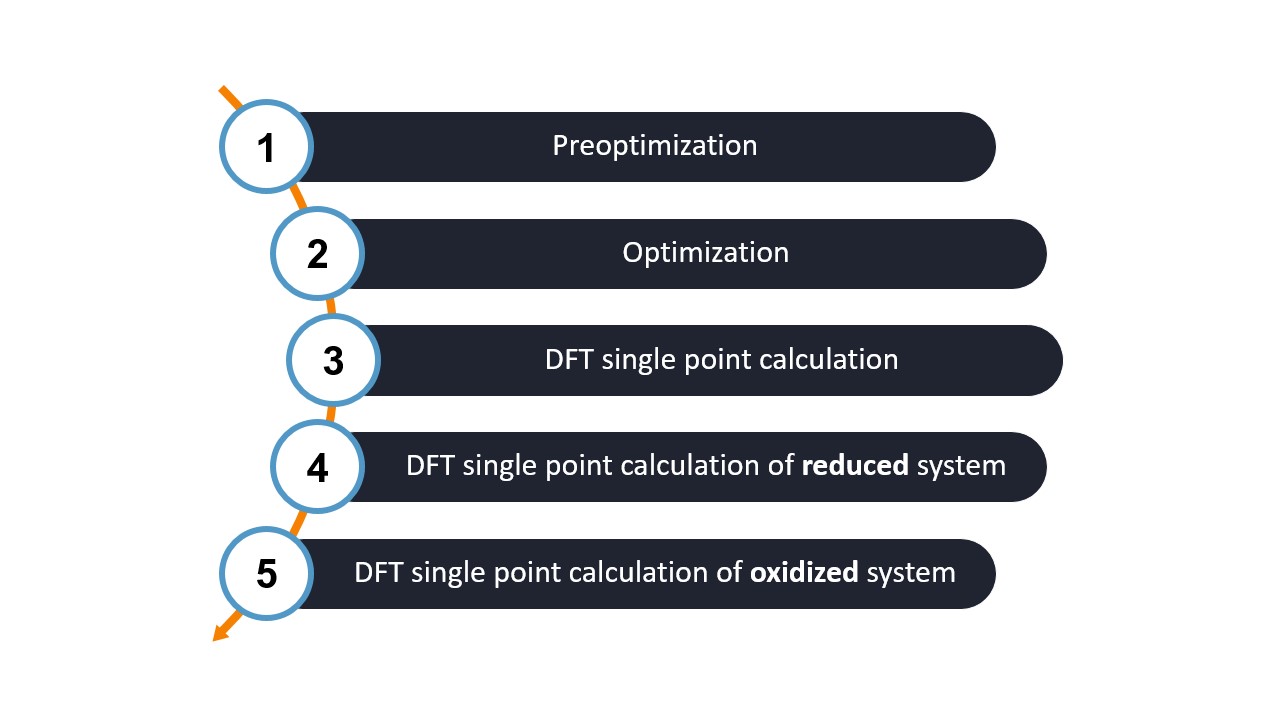
Steps of the WEASEL workflow
Let's break down the WEASEL workflow into its main steps:
As the workflow shows, three different systems are needed to compute the Fukui function:
The neutral system: This is the system with the original input charge and has an electron density denoted by
.
The reduced system: In this system we introduce an additional electron, resulting in a new electron density denoted as
.
The oxidized system: Here we remove one electron from the neutral system, resulting in an electron density denoted as
.
In the Fukui workflow it is only necessary to specify the neutral system and WEASEL will automatically generate the reduced and oxidized systems. In our case the neutral system is butyrolactone.
The Fukui workflow consists of five steps, the first three of which are identical to the basic workflow. You can modify the default methods as described here. The goals of these three steps are as follows:
Step 1 and Step 2: Structure Preoptimization and Optimization - The first step in the workflow is to perform structure pre-optimization and optimization to find the most stable configuration of the molecule under investigation.
Step 3: Single-Point (SP) DFT Calculations - After the structure optimization, we perform the SP DFT calculation to generate the electron density (ED).
Step 4 and Step 5: SP DFT calculations of the reduced and oxidized systems - The single point DFT calculation is repeated for the reduced and oxidized systems to obtain their specific electron densities.
All five steps are done using ORCA.
Once we have the electron densities for the three systems, WEASEL calculates the Fukui functions. The Fukui functions are calculated using the following definitions:
Fukui f+ function: This function, denoted as
 , is obtained by subtracting the electron density of the neutral
system from the electron density of the reduced system:
, is obtained by subtracting the electron density of the neutral
system from the electron density of the reduced system:
Fukui f-function: Similarly, the Fukui f function, denoted as
 , is calculated by subtracting the electron density
of the neutral system from the electron density of the oxidized system:
, is calculated by subtracting the electron density
of the neutral system from the electron density of the oxidized system:
The results are stored and accessible in the output files discussed in the next section.
Output files and results:
During the workflow, several files are created that are important for analyzing the results. These files are organized in a directory structure and serve different purposes:
.
├── butyrolactone.xyz
└── butyrolactone
     ├── butyrolactone.input.xyz
     ├── butyrolactone.report
     ├── butyrolactone.restart.tsv.bz2
     ├── butyrolactone.results.xyz
     ├── butyrolactone.summary
     ├── butyrolactone_Opt.xyz
     ├── butyrolactone_SP_DFT_ED.cube
     ├── butyrolactone_SP_DFT_Fukui+.cube
     ├── butyrolactone_SP_DFT_Fukui-.cube
     ├── butyrolactone_SP_DFT_N+1_ED.cube
     ├── butyrolactone_SP_DFT_N-1_ED.cube
     ├── BuildTopo
     │   └── BuildTopo job files
     ├── PreOpt
     │   └── ORCA job files
     ├── Opt
     │   └── ORCA job files
     └── SP_DFT
         └── ORCA job files
Let's explore the most important files and their contents in the table below:
File |
Description |
|---|---|
butyrolactone_Opt.xyz |
Optimized structure |
butyrolactone_SP_DFT_Fukui-.cube |
Fukui f- function |
butyrolactone_SP_DFT_Fukui-.cube |
Fukui f+ function |
butyrolactone_SP_DFT_ED.cube |
Electron density of neutral molecule |
butyrolactone_SP_DFT_N+1_ED.cube |
Electron density of reduced molecule |
butyrolactone_SP_DFT_N-1_ED.cube |
Electron density of oxidized molecule |
butyrolactone.report |
Output file of the WEASEL run |
butyrolactone.summary |
Summary file for the WEASEL run |
In the WEASEL workflow, several CUBE files are automatically generated to capture important information about the system.
These CUBE files include the electron density of the neutral, reduced, and oxidized molecules, as well as the
Fukui f+ and f- functions ( ) and ).
To visualize these CUBE files, you can use any visualization program that can read cube file formats, such as Avogadro.
) and ).
To visualize these CUBE files, you can use any visualization program that can read cube file formats, such as Avogadro.
Note
Instead of CUBE files VIS files can be generated by using the keyword -plot-format followed by the option vis.
The following two figures illustrate the results of the two Fukui functions.
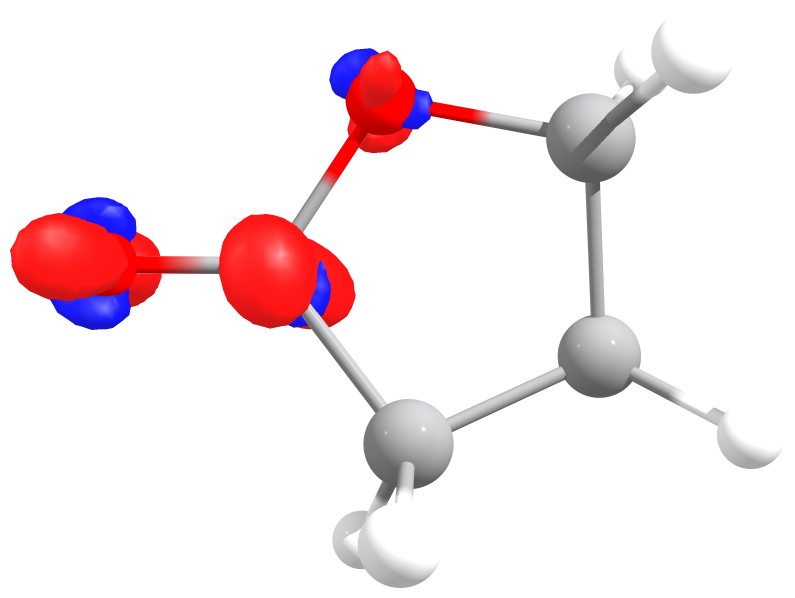
Fukui f+ function of butyrolactone. The red isosurface shows positive regions,
i.e. where the extra electron is added.
As you can see for the largest value is on the carbon atom of the carbonyl,
just what is expected from basic organic chemistry.
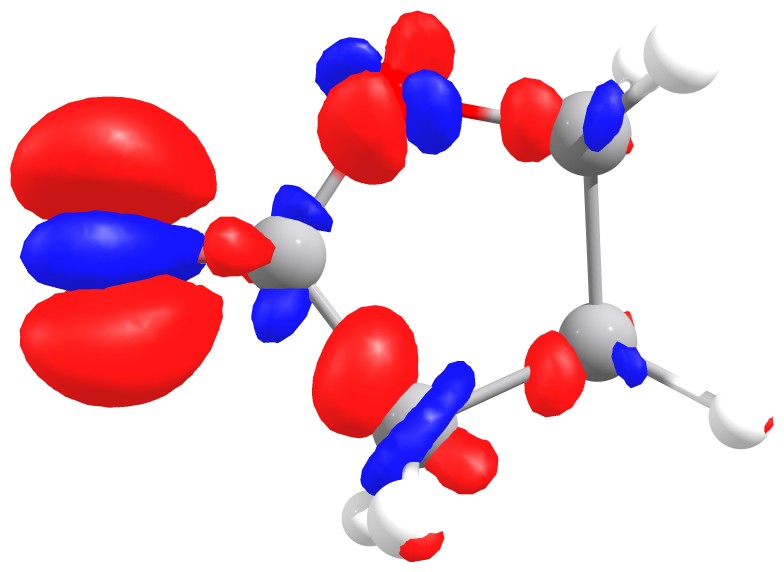
Fukui f- function of butyrolactone. The red isosurface shows positive regions,
i.e. where the extra electron going from oxidized to neutral species is added.
The corresponding function shows that
the highest value is around the oxygen of the carbonyl, the one that should interact stronger with electrophilic species,
again as predictable from experience.
In addition to the visual images obtained from the CUBE files, the summary and report files provide valuable information about the electronic properties and reactivity of the systems.
The summary file contains, in addition to the single point DFT energies of the three systems (neutral, reduced and oxidized), the electron affinity (EA), ionic potential (IP), electronegativity and hardness (Eta), as shown in the following copy of the summary file:
Energy [kcal/mol] / Value      Type                   Calculation type    Method     Basis Set   Solvent        Charge  Multiplicity  Further tags
-12411.135603                  SP-Energy              PreOpt              XTB        None        ALPB(H2O)       0       1
-192301.883932                 SP-Energy              Opt                 r2SCAN-3c  None        CPCM(Water)     0       1
-192356.947935                 SP-Energy              SP_DFT              wB97X-V    def2-TZVP   CPCM(Water)     0       1
-192359.127721                 SP-Energy              SP_DFT              wB97X-V    def2-TZVP   CPCM(Water)    -1       2            Fukui reduced state
-192173.146827                 SP-Energy              SP_DFT              wB97X-V    def2-TZVP   CPCM(Water)     1       2            Fukui oxidized state
 0.0945                        EA (eV)                SP_DFT_Fukui        wB97X-V    def2-TZVP   CPCM(Water)    -1       2
 7.9704                        IP (eV)                SP_DFT_Fukui        wB97X-V    def2-TZVP   CPCM(Water)     1       2
 4.0324                        Electronegativity (eV) SP_DFT_Fukui        wB97X-V    def2-TZVP   CPCM(Water)     0       1
 3.9379                        Hardness (eV)          SP_DFT_Fukui        wB97X-V    def2-TZVP   CPCM(Water)     0       1
While the calculated energy values are usually given in [kcal/mol], the EA, IP, electronegativity and hardness are given in [eV]. The EA represents the energy change when an electron is added to the system, while the IP describes the energy required to remove an electron from the system. Electronegativity characterizes the ability of an atom to attract electrons, while hardness measures the resistance of a system to electron transfer.
A summary of the calculation results is also provided at the end of the report file:
************************
     Fukui: SUMMARY
************************

Computed properties:
EA  = Electron Affinity [eV]
IP  = Ionization Potential [eV]
EN  = Electronegativity [eV]
Eta = Hardness (IP - EA) [eV]
f+  = Computed Fukui f+ function
f-  = Computed Fukui f- function
(Note: 'Y' means it was computed, 'N' means not.)
+-----------+-------+-------+-------+-------+----+----+
| Structure |   EA  |   IP  |   EN  |  Eta  | f+ | f- |
+-----------+-------+-------+-------+-------+----+----+
|     1     | 0.095 | 7.970 | 4.032 | 3.938 | Y  | Y  |
+-----------+-------+-------+-------+-------+----+----+
Remarks and keywords
Keywords related to the Fukui caluclation:
General keywords:
Keyword |
Description |
|---|---|
|
Compute Fukui function on DFT SP level.
|
Keywords for different plotting options:
Keyword |
Description |
|---|---|
|
Output format for plots (MO, ED, SD). Allowed options P are: cube, vis. |
|
Grid resolution, i.e. number of grid points per Angstrom (x, y, and z
direction) for plots (MOs, ED, SD).
|
|
Number of grid points in x direction for plots (MO, ED, SD). |
|
Number of grid points in y direction for plots (MO, ED, SD). |
|
Number of grid points in z direction for plots (MO, ED, SD). |
|
Minimum dimension on the x axis in Angstrom. |
|
Minimum dimension on the y axis in Angstrom. |
|
Minimum dimension on the z axis in Angstrom. |
|
Maximum dimension on the x axis in Angstrom. |
|
Maximum dimension on the y axis in Angstrom. |
|
Maximum dimension on the z axis in Angstrom. |
|
Minimum dimension on x, y and z axis in Angstrom. |
|
Maximum dimension on x, y and z axis in Angstrom. |