IR spectroscopy
Infrared (IR) spectra is a spectroscopic technique used to study the vibrational modes of molecules. It provides information about the functional groups present in a molecule, as well as insight into its structure and chemical bonding.
To predict IR spectra, we can use the IR workflow in WEASEL. Let's take the example of aspirin, which we discussed previously in the context of NMR spectroscopy, and use it to explain the IR workflow and its results step by step.
How to run the calculation
If you would like to perform the IR calculation for the aspirin example, there are two options:
Using XYZ coordinates: You can use the XYZ coordinates from the previous chapter on NMR spectroscopy and copy them to a XYZ file (aspirin.xyz). To run the calculation, use the following command in the terminal:
weasel aspirin.xyz -W Spectrum-IR
The respective XYZ file aspirin.xyz can be downloaded here.
Using SMILES string: Alternatively, you can use the SMILES string for aspirin, which is CC(=O)Oc1ccccc1C(=O)O. and run the following command in the terminal:
weasel -smiles 'CC(=O)Oc1ccccc1C(=O)O' -W Spectrum-IR
Running either of these commands will initiate the IR workflow in WEASEL, which will calculate and generate the IR spectrum for aspirin.
Steps of the WEASEL workflow
The WEASEL workflow for IR spectroscopy follows the steps outlined in the diagram below:
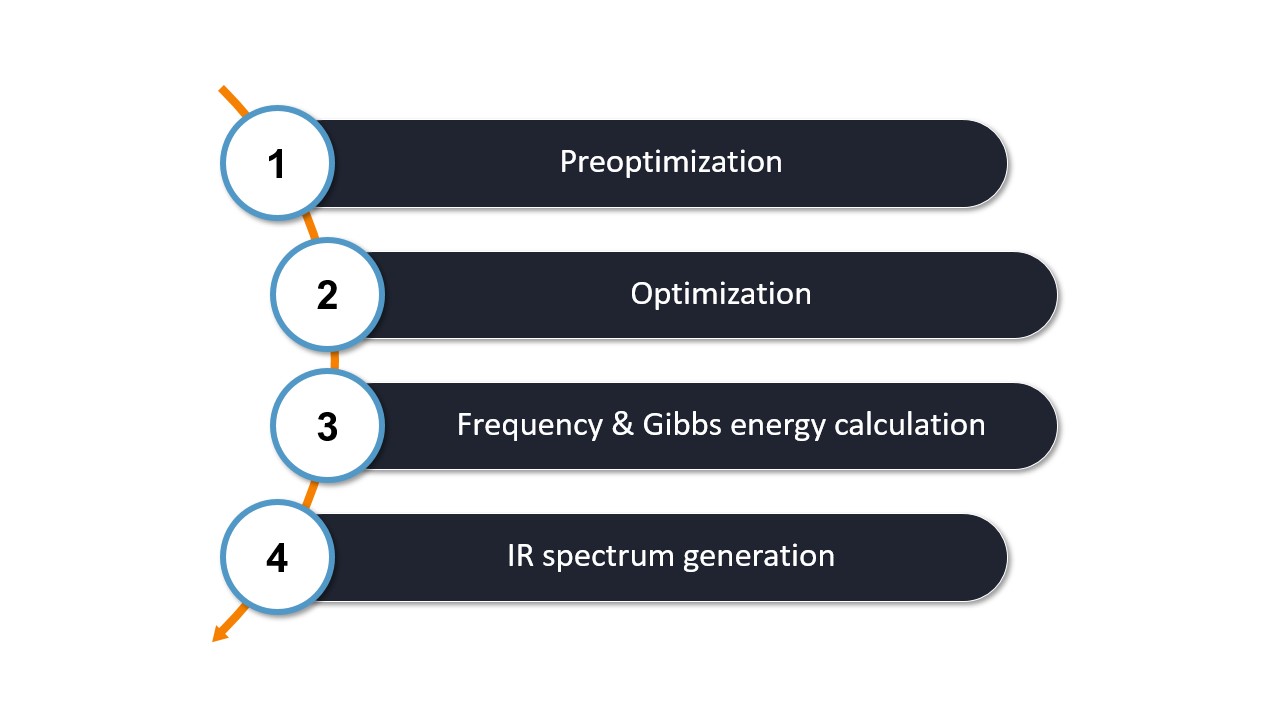
The first two steps of the workflow are identical to the basic workflow, which includes
Step 1: Preoptimization - The initial molecular structure is preoptimized with ORCA using XTB by default.
Step 2: Optimization - The pre-optimized structure is then refined by optimization with ORCA using r2SCAN-3c by default.
After these two steps, the calculations specific to the IR worklfow are performed:
Step 3: Frequency Calculation - The optimized structure is used to perform a frequency calculation with ORCA at the same level as the optimization step. This calculation determines the vibrational frequencies and intensities necessary to generate the IR spectrum.
Step 4: IR spectrum generation - WEASEL extracts the relevant data from the ORCA frequency calculation to generate the IR spectrum.
Note
You can modify the default methods used for workflow steps 1-3 according to your needs and preferences using the provided keywords here.
Note
By default the IR workflow is performed in the gas phase.
You can switch to a different solvent by using the keyword -solvent [solvent].
The list of solvents can be found here.
Output files and results:
During the workflow, several files are created that are important for analyzing the results. These files are organized in a directory structure and serve different purposes:
.
├── aspirin.xyz
└── aspirin_Spectrum-IR
    ├── aspirin_IR.avogadro.out
    ├── aspirin_IR.dx
    ├── aspirin_IR.svg
    ├── aspirin_IR.tsv
    ├── aspirin_Opt.xyz
    ├── aspirin_Spectrum-IR.input.xyz
    ├── aspirin_Spectrum-IR.report
    ├── aspirin_Spectrum-IR.restart.tsv.bz2
    ├── aspirin_Spectrum-IR.results.sdf
    ├── aspirin_Spectrum-IR.results.xyz
    ├── aspirin_Spectrum-IR.summary
    ├── BuildTopo
    │   └── BuildTopo job files
    ├── PreOpt
    │   └── ORCA job files
    ├── Opt
    │   └── ORCA job files
    └── Freq
        └── ORCA job files
Let's explore the most important files and their contents in the table below:
File |
Content |
|---|---|
aspirin_IR.avogadro.out |
Can be opened with Avogadro for spectra simulation, structure &
normal mode analysis.
|
aspirin_IR.dx |
IR data in JCAMP-DX format. |
aspirin_IR.svg |
Visualization of IR spectrum. |
aspirin_IR.tsv |
IR data in TSV format. |
aspirin_Spectrum-IR.report |
Report file of the workflow. |
aspirin_Spectrum-IR.summary |
Summary of the energies of the workflow steps. |
The IR spectral data, represented in units of wavenumbers [cm-1], can be obtained from the IR workflow in two different formats: TSV and JCAMP-DX. The resulting IR spectrum can be visualized directly from the SVG file. The result from the SVG file for aspirin is shown below.

Calculated IR spectrum of aspirin.
IR spectrum ensemble workflow
The workflow described is intended for one molecular structure at a time. However, the IR spectrum ensemble workflow allows the calculation of IR spectra for an ensemble of conformers, which is particularly relevant for cases like aspirin, where multiple conformers may exist.
To run the workflow, you can use the following command with the previously created molecular structure XYZ file or SMILES string:
weasel aspirin.xyz -W Spectrum-UVVisCD-Ensemble
The workflow differs from the single structure NMR spectrum workflow in that it incorporates a conformational search, as described in the section on Conformational Searches. For the case of aspirin, the resulting conformers are visualized below.
Next, the IR spectrum of the final conformer ensemble is calculated. The resulting overall IR spectrum is Boltzmann weighted, meaning that each conformer'scontribution to the final spectrum is determined by its Boltzmann population factor.
The figure below shows the Boltzmann weighted results, where the colors represent the contributions from different conformers as provided in the SVG file. In this example, the workflow resulted in four conformers contributing to the final overall spectrum (represented by the blue solid line).

Calculated IR spectrum of the aspirin conformere esemble.
None of these conformers matched the structure calculated in the single molecule workflow. This discrepancy suggests that the previous workflow only found a local energy minimum instead of the global minimum. It highlights the importance of considering the entire ensemble of molecules rather than a single structure when studying molecules such as aspirin.
Note
The Boltzmann weighting is temperature dependent with a default temperature of 298.5 K.
The temperature can be changed using the keyword -temp followed by the temperature in Kelvin.
Raman spectrum workflow
In addition to predicting IR spectra, Raman spectra can also be predicted using the Raman workflow. Raman spectra are a type of vibrational spectroscopy that involves the scattering of light by molecules, providing information about the vibrational modes and molecular structure.
The Raman workflow is identical to the IR workflow, with the key difference being the generation of the Raman spectrum in addition to the IR spectrum. Therefore, it will not be discussed in detail, but only a brief overview of the Raman spectrum workflow will be provided.
To perform the Raman calculation for aspirin, you can use the previous XYZ structure data of aspirin or the SMILES string and run the following command:
weasel aspirin.xyz -W Spectrum-Raman
Equivalent to the IR workflow, the Raman workflow can also be run for an ensemble as follows:
weasel aspirin.xyz -W Spectrum-Raman-Ensemble
The Raman workflow generates additional files along with the ones generated in the IR workflow. These files contain the Raman spectrum data and are labeled accordingly.
The Raman spectrum of aspirin, generated using the Raman workflow, is shown in the figure below:

When the Raman workflow is run on an ensemble, the ensemble Raman spectrum is represented as shown below:

Remarks and keywords
Note
WEASEL's IR calculation uses a harmonic oscillator approximation. To account for missing anharmonic effects and thus better match the experiment, the calculated spectrum is scaled by 0.9658 in the default IR workflow, as recommended from the literature (https://pubs.acs.org/doi/10.1021/jp508422u).
This scaling factor can be changed using the keyword -ir-scalefreq followed by a chosen scaling factor. See also below for more
information.
Keywords related to IR calcualtions:
Keywords for IR and related calcualtions:
Keyword |
Description |
|---|---|
|
Runs IR workflow as described above. |
|
Runs IR workflow on ensemble as described above. |
|
Runs Raman workflow as described above. The workflow generates IR
and Raman spectra.
|
|
Runs IR workflow on ensemble as described above. The workflow generates IR
and Raman spectra.
|
|
Runs a IR calculation but not the entire workflow for IR
spectrum prediction.
|
|
Runs a Raman calculation, which also implies an IR spectrum calculation.
No Raman spectrum is calculated in the IR workflow or via the keyword
-ir. |
Keywords for different spectrum plotting options:
Keyword |
Description |
|---|---|
|
The harmonic frequencies are scaled by a factor F before generating
IR/Raman spectra. F is 0.9658 in the default IR workflow. The default for
F depends on the chosen method (B3LYP/def2-TZVP: 0.9671, BP86/
def2-TZVP: 0.9953, r2SCAN/def2-TZVP: 0.9671, r2SCAN-3c: 0.9658).
|
|
The keyword determines the number N of data points for generating
spectrum plots.The default for N in the IR workflow is 1000.
|
|
The keyword determines the lineshape function - Gaussian or Lorentzian -
for spectrum peak broadening. The default is Lorentzian broadening in the
IR workflow.
|
|
The keyword determines the linewidth (full width at half maximum) for
spectrum plots in [cm-1] for IR/Raman. The default is 30 cm-1 in the
IR workflow.
|