UV/Vis and CD spectroscopy
UV/Vis (ultraviolet/visible) absorption spectra <https://en.wikipedia.org/wiki/Ultraviolet%E2%80%93visible_spectroscopy>`_ provide information about the wavelengths of light that a molecule can absorb, particularly in the UV and visible regions. UV/Vis spectra are essential for a variety of applications, including quantitative analysis, compound identification, pharmaceutical research, quality control, and monitoring chemical kinetics.
In the context of our tutorial, we will use the example of aspirin, which we discussed earlier in the context of NMR Spectroscopy, as an illustrative example to delve into the UV/Vis calculations using WEASEL workflows. The spectra obtained can not only aid in the identification and quantification of aspirin, but also demonstrate the broader utility of UV/Vis spectroscopy in elucidating the electronic properties of diverse compounds. First, the workflow is described step by step for a specific conformation of the aspirin molecule and then for its conformer ensemble.
In addition to the UV/Vis spectrum, the CD (circular dichroism) spectrum <https://en.wikipedia.org/wiki/Circular_dichroism>`_ appears in the same spectral region. Thus, the WEASEL workflow that produces the UV/Vis spectrum also produces the CD spectrum. The CD spectrum, which shows the differential absorption of left and right circularly polarized light, reveals the chiral properties of a molecule. CD spectra play a critical role in the identification of isomers and provide valuable insight into the chiral properties of a molecule. Isomers, molecules with the same molecular formula but different arrangements of atoms, often exhibit different CD spectra due to their unique three-dimensional structures.
After introducing the basics of the combined UV/Vis-CD WEASEL workflow using aspirin as an example, this tutorial will demonstrate the importance of CD spectra for isomer identification using benzyl-4-methoxyphenyl sulfoxide as an example. We will use this example to show how the results obtained from the UV/Vis-CD workflow can be processed using the visualization software TOUCAN. This practical example will not only show the application of CD spectra in isomer identification, but will also guide you through the steps of processing and visualizing the obtained data with the help of TOUCAN.
How to run the calculation
If you'd like to run the aspirin example yourself, you have two options.
First, you can use the XYZ coordinates by either creating the structure yourself
or by downloading the XYZ file aspirin.xyz.
Alternatively, you can use the SMILES string representation of aspirin, which is "CC(=O)Oc1ccccc1C(=O)O".
To perform the workflow, follow one of the two steps below:
Using the XYZ coordinates: Run the following command on your terminal from the directory where the aspirin molecule coordinate file is located.
weasel aspirin.xyz -W Spectrum-UVVisCD
Using the SMILES string: Execute the following command on your terminal:
weasel -smiles 'CC(=O)Oc1ccccc1C(=O)O' -W Spectrum-UVVisCD
Running one of these commands will start the WEASEL workflow for the aspirin molecule, specifically for the calculation of UV/Vis and CD spectra.
Steps of the WEASEL UV/Vis-CD workflow
The WEASEL workflow for UV/Vis-CD spectroscopy follows the steps outlined in the diagram below:
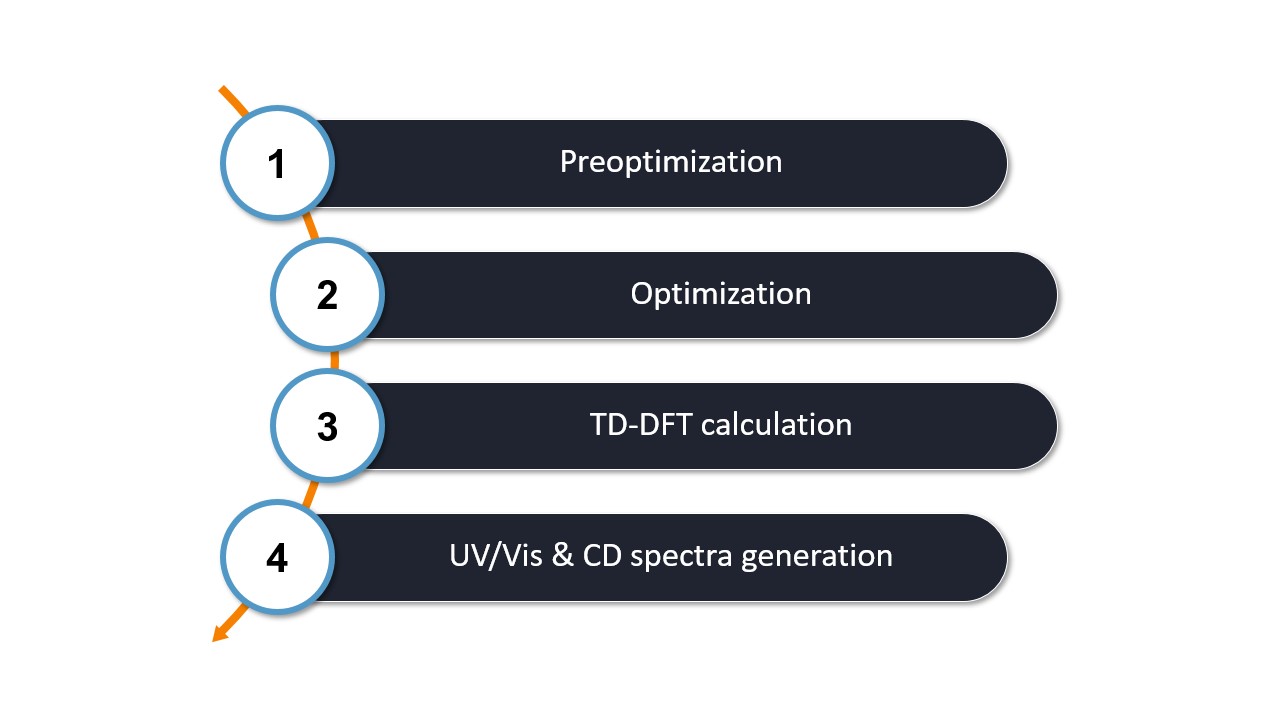
The first two steps of the workflow are identical to the basic workflow, which includes
Step 1: Preoptimization - The initial molecular structure is preoptimized with ORCA using XTB by default.
Step 2: Optimization - The pre-optimized structure is then refined by optimization with ORCA using r2SCAN-3c by default.
After these two steps, the calculations specific to the UV/Vis-CD worklfow are performed:
Step 3: TD-DFT Calculation - The optimized structure is used to perform a TD-DFT calculation with ORCA. The calculation is performmed with the funcational CAM-B3LYP and the basis set def2-TZVPD. This calculation determines the optical excited states and their respective intensities needed to generate the UV/Vis and CD spectra.
Step 4: UV/Vis and CD spectra generation - WEASEL extracts the relevant data from the ORCA frequency calculation to generate the two spectra.
Note
You can modify the default methods used for workflow steps 1 and 2 according to your needs and preferences using the provided
keywords here. To change the method of the TD-DFT calculation in step 3, you can us the keywords -spdft-method
followed by the desired method and -spdft-basis followed by the basis set
Note
By default the UV/Vis-CD workflow is performed in the solvent chloroform.
You can switch to a different solvent by using the keyword -solvent [solvent].
The list of solvents can be found here.
Output files and results
The following files and folders are created during the workflow:
.
├── apsirin.xyz
└── aspirin_Spectrum-UVVisCD
    ├── aspirin_CD_data.eV.tsv
    ├── aspirin_CD_data.nm.tsv
    ├── aspirin_CD.eV.svg
    ├── aspirin_CD.nm.svg
    ├── aspirin_ES_peaks.txt
    ├── aspirin_Opt.xyz
    ├── aspirin_Spectrum-UVVisCD.input.xyz
    ├── aspirin_Spectrum-UVVisCD.report
    ├── aspirin_Spectrum-UVVisCD.restart.tsv.bz2
    ├── aspirin_Spectrum-UVVisCD.results.xyz
    ├── aspirin_Spectrum-UVVisCD.summary
    ├── aspirin_UVVis.avogadro.out
    ├── aspirin_UVVis_data.eV.tsv
    ├── aspirin_UVVis_data.nm.tsv
    ├── aspirin_UVVis.dx
    ├── aspirin_UVVis.eV.svg
    ├── aspirin_UVVis.nm.svg
    ├── BuildTopo
    │   └── BuildTopo job files
    ├── PreOpt
    │   └── ORCA job files
    ├── Opt
    │   └── ORCA job files
    └── SP_DFT
        └── ORCA job files
The most important files and their content are listed in the table below.
File |
Content |
|---|---|
aspirin_UVVis.avogadro.out |
Can be opened with Avogadro for spectra simulation,
structure & orbital analysis.
|
aspirin_CD_data.eV.tsv |
CD data in TSV format in eV. |
aspirin_CD_data.nm.tsv |
CD data in TSV format in nm. |
aspirin_CD.eV.svg |
Visualization of CD spectrum in eV. |
aspirin_CD.nm.svg |
Visualization of CD spectrum in nm. |
aspirin_UVVis_data.eV.tsv |
UV/Vis data in TSV format in eV. |
aspirin_UVVis_data.nm.tsv |
UV/Vis data in TSV format in nm. |
aspirin_UVVis.eV.svg |
Visualization of UV/Vis spectrum in eV. |
aspirin_UVVis.nm.svg |
Visualization of UV/Vis spectrum in nm. |
aspirin_UVVis.dx |
UV/Vis data in JCAMP-DX format. |
aspirin_ES_peaks.txt |
Orbitals involved and all peaks of UV/Vis spectrum. |
aspirin_Spectrum-UVVisCD.report |
Report file of the workflow. |
aspirin_Spectrum-UVVisCD.summary |
Summary of the energies of the workflow steps. |
As noted in the table, the UV/Vis and CD spectra data are saved in two different formats, TSV and JCAMP-DX, and for two different units, [nm] and [eV]. The final plotted UV/Vis and CD spectra in the SVG files are also saved in [nm] and [eV], as shown below for the [nm] example.

Calculated UV/Vis spectrum of aspirin in [nm].

Calculated CD spectrum of aspirin in [nm].
Details on the energy of the peaks and the characterization of the underlying transitions in the orbital representation can be obtained from a TXT file. For the example of aspirin it is called aspirin_ES_peaks.txt, where ES stands for excited states.
The analysis of aspirin indicates that excitations in the HOMO-LUMO region dominate the spectrum in the higher wavelength region, as shown in the following TXT file excerpt.
PEAK 1
4.953 eV | 39949.0 cm**-1 | 250.32 nm
 79%  HOMO   --> LUMO
 11%  HOMO-1 --> LUMO+1
========================================
PEAK 2
 5.232 eV | 42199.7 cm**-1 | 236.97 nm
 38%  HOMO-1 --> LUMO
 33%  HOMO-3 --> LUMO
 13%  HOMO-2 --> LUMO
========================================
[...]
UV/Vis and CD spectra ensemble workflow
The described workflow is intended for one molecular structure at a time. However, it is also possible to calculate a conformational ensemble. This can be important in the particular case of aspirin, where multiple conformers are possible.
The workflow can be started with the following command or with the SMILES string as given above:
weasel aspirin.xyz -W Spectrum-UVVisCD-Ensemble
The workflow differs from the single structure UV/Vis-CD spectrum workflow in that it first performs a conformer search as described here on a given structure. The resulting conformers for aspirin are visualized below.
Calculated conformers of aspirin based on the conformer search workflow.
It then computes the UV/Vis spectrum and CD spectrum of this final conformer ensemble. The final spectra are Boltzmann weighted. This means that the contribution of each conformer to the final spectra is determined by a factor based on the Boltzmann population.
The UV/Vis and CD spectra shown in the figures below are Boltzmann weighted and the colors represent the contribution of the different conformers. The workflow resulted in four conformers contributing to the final spectra, but none of them was the same as the one calculated in the single molecule workflow. This indicates that the previous workflow only found a local minimum on the energy surface instead of the global minimum, and highlights the potential of considering the entire ensemble of molecules rather than just one particular structure for molecules such as aspirin.
The importance of the conformer ensemble is particularly evident for the total CD spectrum, which disappears when the weighted total spectrum is calculated (blue solid line). This is expected from the experiment since there is no CD spectrum for aspirin.

Calculated UV/Vis spectrum of the aspirin conformere esemble in [nm].

Calculated CD spectrum of the aspirin conformere esemble in [nm].
Note
The Boltzmann weighting is temperature dependent with a default temperature of 298.5 K.
The temperature can be changed using the keyword -temp followed by the temperature in Kelvin.
Benzyl-4-methoxyphenyl-sulfoxide - A case study
Since the aspirin example demonstrated that the UV/Vis-CD WEASEL workflow did not have a CD spectrum, we will now present another example to show how the workflow can effectively identify R/S isomers using CD spectra.
Let's consider the following experimental CD spectrum:

Experimental CD spectrum of a benzyl-4-methoxyphenyl sulfoxide isomer.
You can download the data for the CD spectrum
as well as for the corresponding UV/Vis spectrum.
This spectrum corresponds to benzyl-4-methoxyphenyl sulfoxide.
However, it is uncertain whether it is the R or S isomer.
This is where the UV/Vis-CD WEASEL workflow comes in handy.
We begin by constructing the structures for both the R and S isomers of benzyl-4-methoxyphenyl sulfoxide.
To follow along, you can use the SMILES string COc1ccc(S@Cc2ccccc2)cc1 or
download the XYZ data for the R isomer
and for the S isomer you can use the SMILES string COc1ccc(S@@Cc2ccccc2)cc1 or
download the XYZ data.
As we learned from the aspirin example, when dealing with a molecule with multiple conformers, as expected for benzyl-4-methoxyphenyl sulfoxide, the ensemble workflow is likely to yield better results than the single structure workflow. Therefore, we will run the appropriate workflow for both isomers with the following commands:
$ weasel S-MeOPh-benzyl-sulfoxide.xyz -W Spectrum-UVVisCD-Ensemble
and:
$ weasel R-MeOPh-benzyl-sulfoxide.xyz -W Spectrum-UVVisCD-Ensemble
Similar to our previous procedure, we can review the calculated spectra. However, for a direct comparison with the experiment, we will postpone viewing the SVG files for now and instead use TOUCAN to visualize the results.
Once TOUCAN is started and the UV/Vis/CD option is selected, we can use the SDF files of the two isomers generated by WEASEL. These files contain the molecular structure as well as the CD and UV/Vis spectra. Load these files together with the experimental CD and UV-Vis spectra into TOUCAN as shown in the figure below.
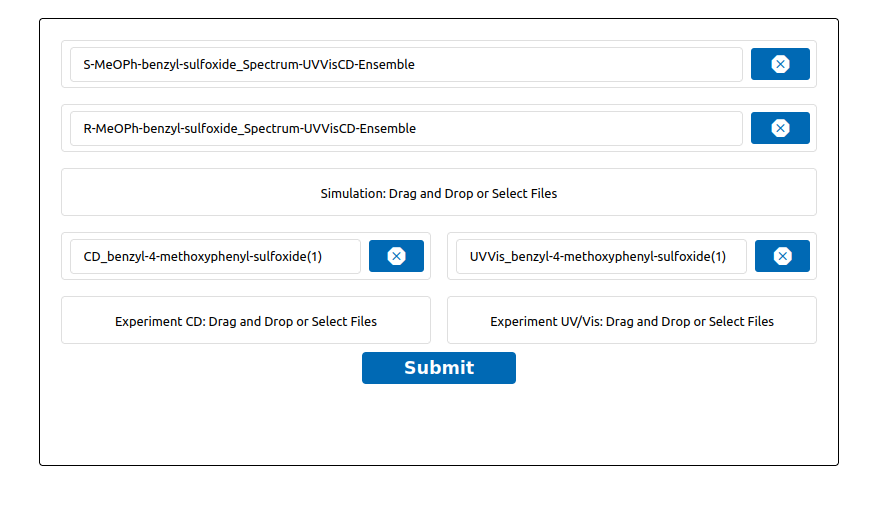
Load data into TOUCAN.
Upon data submission, TOUCAN matches the data with the experiment automatically, as shown below. In case of a disagreement between your result and the experiment, use the "Best Fit" button.
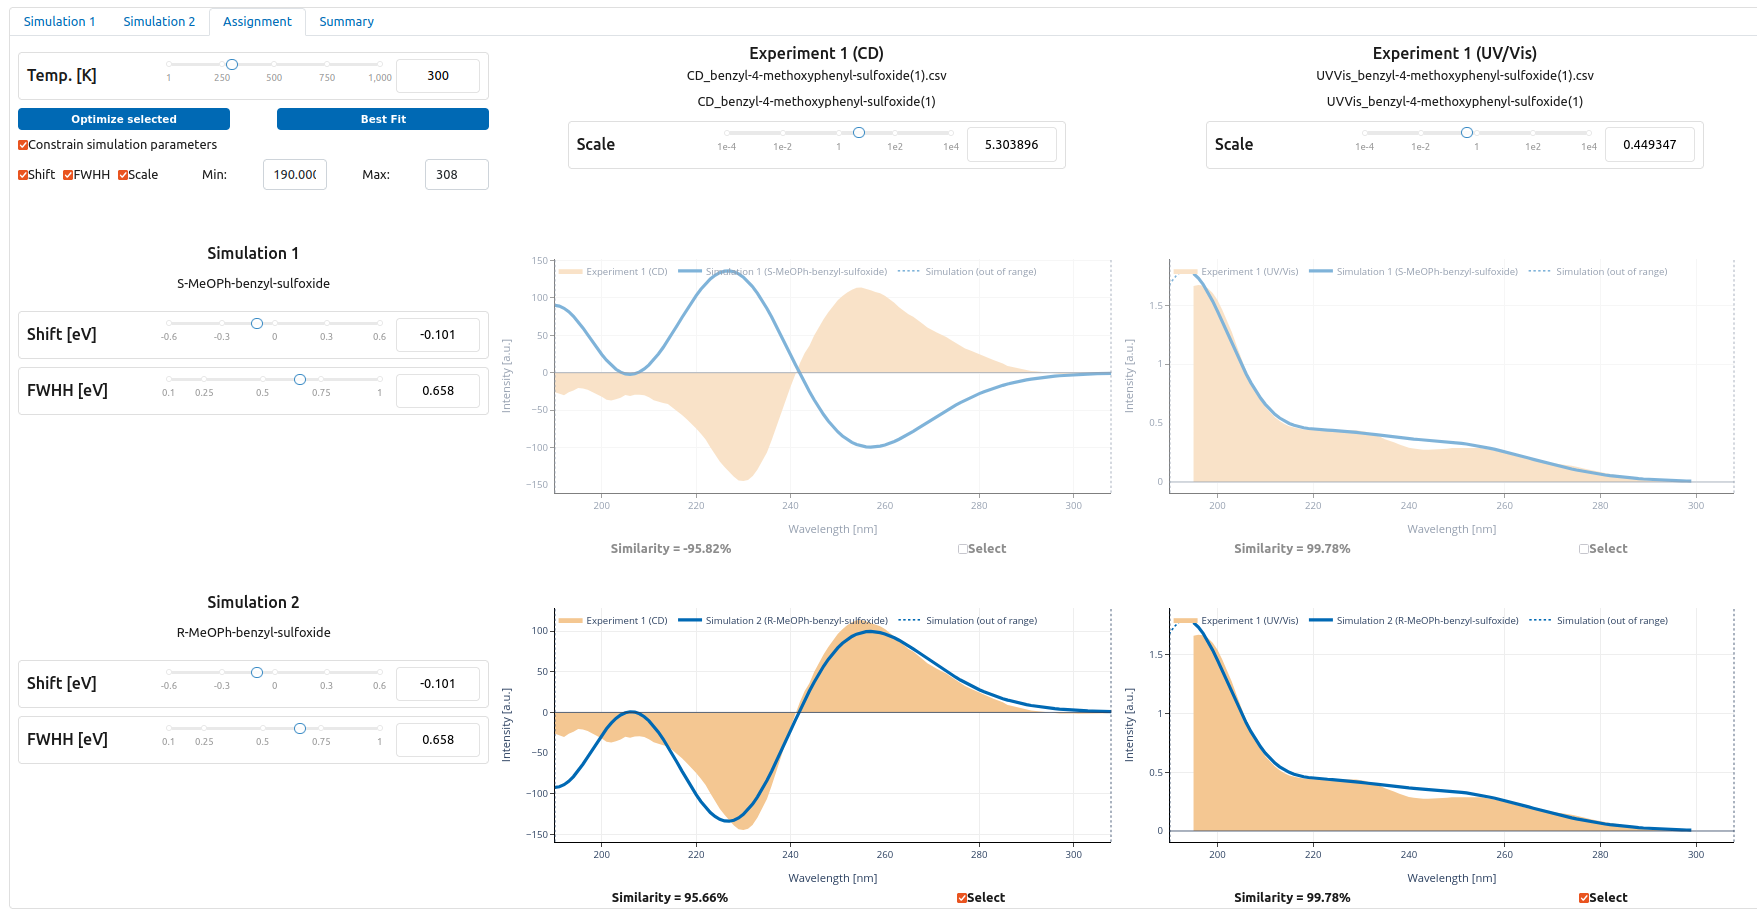
TOUCAN dash board with fitted data to experiment - S-isomer (top) and R-isomer (botton) (click on figure to increase size).
The automated analysis of the calculated spectra for the two isomers clearly indicates that the experimental spectrum corresponds to R-benzyl-4-methoxyphenyl sulfoxide.
Remarks and keywords
Note
The default wavelength target for TD-DFT calculations is set to 300 nm. In cases where the current calculation does not reach
this target, additional TD-DFT calculations are performed with more roots until the target is reached. These calculations are extended by 20 roots for each failed attempt, with a maximum of 100 additional roots. The number of roots can
be set to a fixed number with the keyword -es-nroots followed by an integer.
Keywords related to UV/Vis and CD calculations:
Keywords for different TD-DFT methods:
Keyword |
Description |
|---|---|
|
Runs UVVis-CD workflow as described above. |
|
Runs UVVis-CD workflow on ensemble as described above. |
|
Runs (basic) TD-DFT calculation for UV/Vis-CD spectrum prediction.
|
|
The Tamm-Dancoff approximation (TDA) is used for the TD-DFT
calcualtion. This is the default for TD-DFT calculations in WEASEL.
|
|
TDA is not used for the TD-DFT calcualtion. |
Keywords for excited state optimization:
Keyword |
Description |
|---|---|
|
Number of roots for UV/Vis / CD spectrum prediction. The keyword
must be followed by an integer (TD-DFT_NROOTS).
|
|
The excited states calculated with TD-DFT are optimized. |
|
A specific excited state calculated with TD-DFT is optimized. The keyword
must be followed by the number (integer) of the state to be optimized.
|
|
Use of spin-adapted triplets to optimize the excited state of triplets. |
Keywords for different spectrum plotting options:
Keyword |
Description |
|---|---|
|
The keyword determines the number N of data points for generating
spectrum plots.
|
-spectrum-lineshape {GAUSSIAN, LORENTZIAN} |
The keyword determines the lineshape function - Gaussian or Lorentzian -
for spectrum peak broadening.
|
|
The keyword determines the linewidth (full width at half maximum)
for spectrum plots in [eV] for UV/Vis and CD spectra.
|